Maps Mapping
What are the best software tools for creating mind maps ?
Best Software Tools for Creating Mind Maps Mind maps are an excellent way to visually organize information, ideas, and thoughts. They help in brainstorming, planning, and problem-solving. There are several software tools available that make it easy to create mind maps. Here are some of the best ones: 1. XMind is a powerful mind mapping tool that offers a range of features to create professional-looking mind maps. It has a user-friendly interface and supports various chart types, including tree, logic, and matrix. XMind also allows you to import and export data in different formats, making it easy to share your work with others. 2. MindMeister is an online mind mapping tool that lets you create mind maps directly in your browser. It offers real-time collaboration, allowing multiple users to work on the same mind map simultaneously. MindMeister also integrates with popular apps like Google Drive and Dropbox, making it easy to save and share your work. 3. Coggle is another online mind mapping tool that offers a simple and intuitive interface. It allows you to create beautiful mind maps with images, links, and notes. Coggle also supports collaboration, letting you invite team members to work on the same mind map together. 4. FreeMind is a free, open-source mind mapping tool that offers basic functionality for creating mind maps. It has a clean and straightforward interface, making it easy to get started with mind mapping. FreeMind also allows you to export your mind maps in various formats, including HTML and PDF. 5. iMindMap is a comprehensive mind mapping tool that offers a wide range of features for creating visually stunning mind maps. It has a unique "radial" view that makes it easy to focus on specific areas of your mind map. iMindMap also supports multimedia elements, such as images and audio files, making it an excellent tool for creative projects.
Can mind mapping be effectively used in business settings ?
Mind mapping is a visual tool that can be effectively used in business settings to enhance productivity, creativity, and communication. It helps individuals and teams organize information, generate ideas, and solve problems by creating a structured diagram of related concepts. The benefits of mind mapping in business include improved organization, enhanced creativity, increased productivity, and better communication. To implement mind mapping in business, one should choose the right tool, train their team, integrate it into processes, encourage collaboration, and continuously evaluate its effectiveness.
How can mind maps be used to enhance note-taking and organization ?
Mind maps are an effective tool for organizing information, enhancing memory recall, and improving note-taking. They offer a visual representation of complex ideas, making it easier to understand and remember them. Mind maps can be used in various ways, such as organizing information, enhancing memory recall, and improving note-taking. They utilize visual associations, hierarchical structures, and flexibility to aid in understanding, remembering, and applying complex information in different contexts. Examples of using mind maps include studying, project planning, brainstorming, and taking meeting notes.

In what ways can mind mapping help with project management and planning ?
Mind mapping is a valuable tool for project management and planning, offering benefits such as clarifying objectives, enhancing brainstorming sessions, facilitating task breakdown, tracking progress, managing risks, and improving communication. By providing a visual representation of information, mind maps enable clearer understanding and more effective collaboration among team members, ultimately contributing to the success of projects.
How does mind mapping compare to other brainstorming techniques ?
The text discusses the differences between mind mapping and other brainstorming techniques such as free writing, brainstorming sessions, and sketching. Mind mapping is a visual technique that involves creating a diagram to organize information, while free writing involves writing down ideas without any particular structure or organization. Brainstorming sessions typically involve a group of people working together to generate ideas, while sketching offers more freedom in terms of visual expression and experimentation. The author concludes that mind mapping offers a unique approach to brainstorming that combines structure, visualization, and flexibility, making it particularly effective for those who prefer a visual and organized method of generating and organizing ideas.
How can mind mapping improve creativity and problem-solving skills ?
Mind mapping is a tool that enhances creativity and problem-solving skills by providing a visual way to organize information. It stimulates brainstorming, enhances visualization, and promotes collaboration for creative thinking. Mind mapping also aids in problem-solving by identifying core issues, providing clarity and focus, and facilitating decision making.

What are the benefits of using mind maps in education ?
Mind maps are a valuable tool in education, offering benefits such as enhanced learning and retention, promotion of creative thinking, improved organizational skills, facilitated collaboration, and encouragement of active learning. They cater to visual learners, aid in brainstorming and idea generation, help with information hierarchy and time management, are useful for group work and communication, and increase student engagement and self-assessment. Incorporating mind maps into teaching strategies can create a more effective and engaging learning environment.

How do mind maps aid in studying and retaining information ?
Mind maps are a visual tool that aids in studying and retaining information by improving organization, enhancing creativity, promoting active learning, and facilitating recall. They provide a logical structure for organizing thoughts and connecting ideas, making complex information more accessible. Mind maps also encourage brainstorming and experimentation, leading to better learning outcomes. Additionally, they promote deeper learning through active participation and reflection on understanding. Finally, mind maps facilitate recall by providing visual cues and breaking down information into manageable chunks. Incorporating mind maps into your study routine can boost academic performance and achieve better results in your studies.

Where can I find a map of local cycling routes ?
Cycling is an excellent way to explore your local area, stay fit, and enjoy the outdoors. If you're looking for maps of cycling routes near you, here are some resources that can help: City or Local Government Websites Cycling Clubs or Groups Online Cycling Communities Local Bike Shops Tourism Information Centers Smartphone Apps Google Maps Social Media Library or Bookstore Outdoor Recreational Maps Word of Mouth Remember to always check the condition of the route before heading out, as well as the weather forecast and any potential hazards along the way. Happy cycling!

What are some tips for creating effective mind maps ?
Effective mind maps should start with a central idea, use images and colors, connect ideas with lines, keep it simple, use keywords and phrases, be creative, and review and revise.
How can mind maps help in revising large amounts of information ?
Mind maps are a useful tool for organizing and revising large amounts of information. By visualizing complex information, identifying key themes and relationships, organizing thoughts, improving memory retention, and facilitating creative thinking, mind maps can help learners better understand and retain information. To use mind maps effectively, choose a central idea or theme, create branches for subtopics, add details and examples, connect related ideas, review and refine the map, and use it as a study tool.
Are there any drawbacks or limitations to using mind maps ?
Mind maps are a popular tool for brainstorming, planning, and organizing information. However, they have limitations and drawbacks such as oversimplification of complex information, limited depth, subjectivity and bias, difficulty in handling large amounts of data, reliance on visual memory, and technological limitations. It's essential to be aware of these drawbacks to use them effectively and choose the right tool for the job at hand.

How do I find cycling routes that avoid traffic ?
Cycling is a great way to exercise and explore, but sharing the road with vehicles can be dangerous. To ensure a safe ride, it's important to find cycling routes that avoid traffic. Some tips include using online mapping tools like Google Maps or Strava, checking with local cycling groups, looking for dedicated bike infrastructure, and planning your route ahead of time. By following these steps, you can enjoy a safe and enjoyable ride without worrying about traffic.

Can you suggest some great iPhone apps for travel ?
The text provides a summary of iPhone apps that can be beneficial for travelers. These include TripIt for organizing travel plans, Google Maps for navigation and real-time traffic updates, CityMaps2Go for offline maps and travel guides, XE Currency for currency conversion, Duolingo for language learning, PackPoint for creating customized packing lists, and WhatsApp for secure messaging and staying in touch. These apps can help travelers plan their trips, navigate unfamiliar locations, manage their budgets, learn new languages, pack appropriately, and stay connected with friends and family.
What are the key methods used in environmental monitoring ?
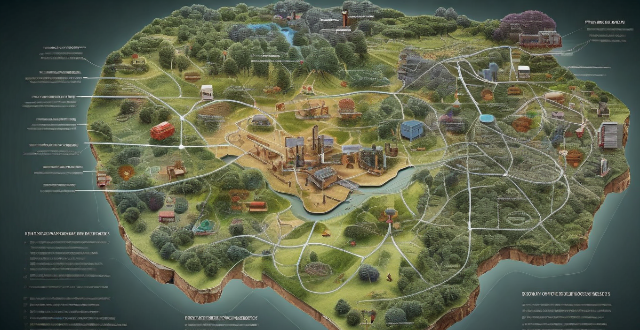
Environmental monitoring is a crucial process that involves the observation, identification, and measurement of various environmental parameters to assess the quality and health of the environment. The key methods used in environmental monitoring include sampling, sensor technology, satellite imagery, and geographic information systems (GIS). Sampling involves collecting samples from different sources such as air, water, soil, and biota and analyzing them in a laboratory to determine the presence and concentration of pollutants. Sensor technology detects and measures pollutants in real-time using sensors that can detect specific pollutants and provide continuous data on their concentrations. Satellite imagery observes changes in land use, vegetation cover, and climate patterns over large areas by analyzing images captured by satellites orbiting the Earth. GIS analyzes spatial data and creates maps showing the distribution of pollutants and their impacts on the environment. These methods are essential for assessing environmental quality and making informed decisions about resource management and risk assessment.

How can I discover new cycling routes in my area ?
Finding new cycling routes can be an exciting adventure. Here are several ways to discover new cycling routes in your area: 1. Use cycling apps and websites like Strava, Komoot, Ride with GPS, and Bikemap. 2. Join local cycling groups through Meetup, cycling clubs, or Facebook groups. 3. Check with local bike shops for route recommendations and group rides. 4. Look at city or county parks departments for maps and events showcasing new routes. 5. Ask friends and family for hidden gem routes and join their rides. 6. Explore on your own by scouting detours on familiar rides and using maps. 7. Attend cycling events like road races and bike festivals to learn about new routes. 8. Use Google Maps to plan custom routes and spot potential paths in satellite view. 9. Check out local guidebooks on cycling in your region at bookstores or the library. 10. Visit local tourist information centers for brochures and advice on scenic routes. By utilizing these methods, you can expand your cycling horizons and enjoy the thrill of discovering new routes in your area while riding safely and respecting the rules of the road and trail.

What are some creative ways to display data in an infographic ?
The text describes various creative ways to display data in an infographic, including: 1. **Use Colors and Shapes**: Colors and shapes can be used to create contrast and highlight important information. Different colors and shapes like circles, squares, or triangles can represent different categories or values of data. 2. **Incorporate Charts and Graphs**: Bar charts, line graphs, pie charts, heatmaps, or treemaps are great for displaying numerical data in an infographic. They help in comparing sales figures, showing trends over time, or illustrating proportions. 3. **Tell a Story with a Timeline**: A timeline helps viewers understand how events unfolded over time, especially useful for historical data or processes that have multiple steps. 4. **Use Icons and Symbols**: Icons and symbols convey information quickly without words and add visual interest to the infographic. Examples include checkmark icons, warning signs, or arrow icons. 5. **Include Maps and Geographic Data**: If the data has a geographic component, incorporating maps can be very effective. This could be world maps, regional maps, or even custom maps for specific locations. 6. **Add Interactive Elements**: Interactive elements such as clickable sections that reveal more details or animations that bring the data to life can make the infographic more engaging. 7. **Use Text Sparingly but Effectively**: Well-placed text provides context and explanation where needed. Clear typography and avoiding clutter with too much text is crucial. By using these methods, one can create an infographic that presents data clearly while also captivating and informing the audience.

What challenges might I face when constructing a knowledge framework, and how can I overcome them ?
The text discusses the challenges in constructing a knowledge framework and provides solutions to these challenges. The challenges include identifying relevant information, structuring the framework, technical limitations, human factors, and maintenance and updates. The solutions suggested are using reliable sources, implementing filtering techniques, consulting with experts, using an iterative approach, visual mapping, modular design, custom development, flexible design, peer review, user testing, feedback loops, automated systems, dedicated teams, and regular reviews. By anticipating potential challenges and implementing appropriate solutions, you can create a robust and effective knowledge framework that supports learning, decision-making, and innovation within your domain.

How can technology be utilized to enhance safety protocols in construction projects ?
The text discusses how technology can enhance safety protocols in construction projects. Wearable technology, such as smart helmets and vests, drone technology for aerial surveillance and 3D mapping, Internet of Things (IoT) sensors for environmental and structural health monitoring, Virtual Reality (VR) and Augmented Reality (AR) for safety training and real-time information, and mobile applications for immediate communication and health monitoring are some of the tools and systems that have been developed to reduce risks and ensure the well-being of workers on site. The integration of these technologies is not just about introducing new gadgets, but about creating a culture of proactive risk management.

Where can I find information on road conditions before starting a trip ?
Before embarking on a journey, it is crucial to gather information about the road conditions to ensure a safe and smooth trip. Here are some reliable sources where you can find information on road conditions: 1. **Government Websites**: Department of Transportation (DOT) and State Department of Transportation (DOT) websites provide up-to-date information on road construction, maintenance, and closures. 2. **Traffic Apps and Websites**: Waze, Google Maps, and INRIX Traffic offer real-time traffic updates, including accidents, road closures, and congestion. 3. **Local News Stations**: TV and radio stations broadcast traffic updates during regular programming, while newspaper websites include traffic sections with updates on accidents and road closures. 4. **Social Media**: Follow local law enforcement agencies, DOTs, and news outlets on Twitter and Facebook for real-time updates on road conditions and emergencies. 5. **Call Centers**: Dial 511 or call your state's police or highway patrol non-emergency number for assistance with road condition inquiries. 6. **Tourist Information Centers**: Visit visitor centers and welcome centers for maps, guides, and information about current road conditions. By utilizing these resources, you can stay informed and make informed decisions while on the road.

How can technology be used to monitor and predict climate conflicts ?
Climate conflicts, exacerbated by competition for natural resources, have significant impacts. Technology is crucial in monitoring and predicting these conflicts through satellite imagery, data analytics, GIS, social media monitoring, mobile technology, and collaboration platforms. These tools help in early warning, predictive modeling, mapping disputes, sentiment analysis, citizen reporting, information dissemination, and multi-sector coordination.
How do I plan a cross-country cycling route ?
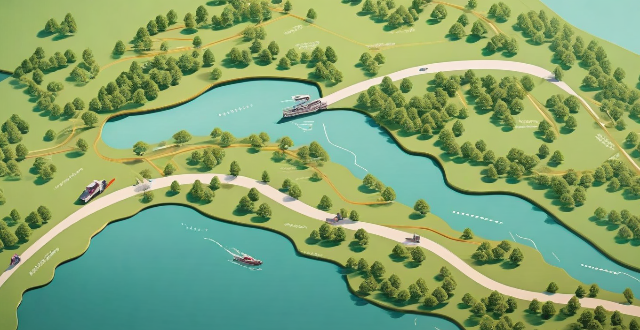
Planning a cross-country cycling route involves determining the starting and ending points, choosing a suitable route, planning daily mileage, booking accommodations/campsites, and packing necessary gear. Factors to consider include distance, terrain, weather conditions, safety concerns, travel restrictions, fitness level, budget, and preferences. Tools like Google Maps, Bikely, or Komoot can help customize the route based on distance, elevation gain, and surface type. Aim for 50-70 miles per day if experienced or 30-40 miles if new to long-distance cycling. Pack spare tubes, pump, multi-tool, first aid kit, food, water, and appropriate clothing for expected weather conditions.

How can IoT be used in agriculture ?
The Internet of Things (IoT) is transforming agriculture by enabling precision farming, crop monitoring, resource management, and livestock management. IoT technologies such as soil moisture sensors, weather stations, drones, GPS-guided equipment, remote sensing, smart traps, yield mapping, smart irrigation systems, variable-rate fertilizer application, energy-efficient lighting, waste management systems, health monitoring devices for livestock, automated feeding systems, milking parlors with sensors, and animal tracking devices are revolutionizing farming practices. These technologies provide farmers with real-time data and insights into their operations, increasing efficiency, reducing costs, improving crop yields, and minimizing environmental impact.
What are some tips for taking great landscape photos with a smartphone ?
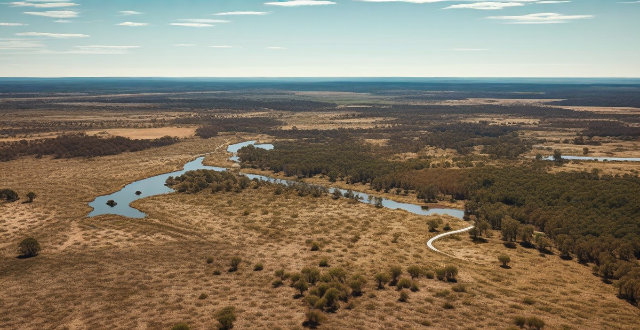
Taking stunning landscape photos with a smartphone involves planning, mastering camera settings, careful composition, and mindful editing. Research your location, check the weather, use mapping apps to plan your shot. Understand your camera's capabilities, use HDR mode, and manual controls for better exposure and focus. Follow the rule of thirds, look for leading lines, include foreground interest, and simplify your composition. Pay attention to lighting, especially during golden hour, and be mindful of exposure to avoid blown-out highlights or blocked-up shadows. Edit your photos thoughtfully, adjusting color temperature, enhancing details, and applying filters sparingly. By following these tips, you can capture breathtaking landscape photos that showcase the beauty of nature through your smartphone's lens.

What are the best methods for taking notes in class ?
The text provides a comprehensive overview of four effective methods for taking notes in class, namely the Cornell Method, Outlining Method, Mind Mapping Method, and Sentence Method. The Cornell Method involves dividing your paper into three sections to organize your notes, while the Outlining Method uses headings and subheadings to create a hierarchical structure. The Mind Mapping Method is a visual technique that involves creating a diagram of connected ideas, and the Sentence Method involves taking notes in complete sentences to better understand and retain information. Each method has its own unique steps and benefits, making it important for students to choose the one that works best for them.
How can we use technology to enhance our climate adaptation efforts ?
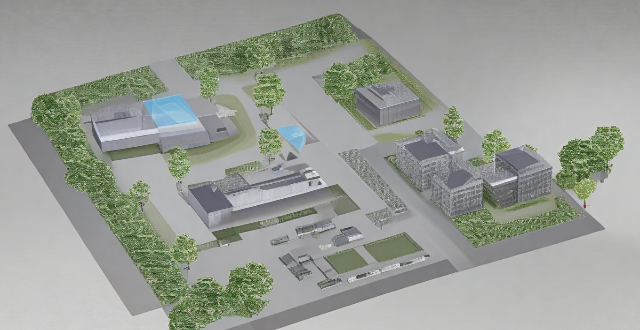
Technology can significantly enhance our climate adaptation efforts by improving data collection, risk assessment, infrastructure development, community engagement, and research innovation. Utilizing advanced sensor networks, satellite imagery, GIS mapping, AI, smart grids, green building technologies, digital platforms, VR/AR, collaborative platforms, and automation can lead to more accurate predictions, efficient resource management, and resilient societies.

What are the best apps or websites for navigating and planning a backpacking trip in Europe ?
Backpacking through Europe can be an exciting adventure with the right planning and navigation tools. Here are some of the best apps and websites to help you plan your trip and navigate unfamiliar territories: ## Best Apps for Backpacking in Europe - Rome2Rio: Find transportation options between destinations, including flights, trains, buses, and ferries. - Hostelworld: Search for affordable accommodation based on location, price, and ratings. - Google Maps: Navigate cities and towns using detailed maps and public transportation routes. - CityMaps2Go: Access offline maps and guides for over 8000 destinations worldwide. - Omio: Book train tickets across Europe with real-time schedules and ticket prices. ## Best Websites for Backpacking in Europe - Eurail: Offers an extensive network of train routes across Europe with discounted rail passes for backpackers. - Interrail: Provides real-time schedules and ticket prices for trains, buses, and ferries. - Lonely Planet: Comprehensive travel guide website with recommendations for accommodations, restaurants, and attractions. - Airbnb: Find unique and affordable accommodation options while backpacking in Europe. - Couchsurfing: Connects travelers with local hosts who offer free accommodation in their homes.

Are there any apps that help in planning a road trip route with attractions and food stops ?
When planning a road trip, there are several apps available that can assist in route planning, finding attractions, and discovering food stops and restaurants. Google Maps offers turn-by-turn directions, points of interest, and customization options. Roadtrippers helps plan a comprehensive itinerary, suggests interesting places to visit, and offers themed trips. Sygic Travel provides information on top attractions, offline maps, and route optimization. Waze offers real-time traffic updates, community-driven features, and voice commands for safer driving. For food stops and restaurants, Yelp provides restaurant reviews, filtering options, and user photos. OpenTable allows reservations, dining specials, and cuisine type filtering. Zomato offers menu viewing, user ratings, and food photos. TripAdvisor provides traveler reviews, top restaurant listings, and nearby options. Combination apps like TripIt offer itinerary management, attraction and dining suggestions, and integration with other apps. Maps.me provides offline maps, POI categories, and custom routing. RV Trip Wizard plans RV-friendly routes, includes campground information, and lists attractions and restaurants suitable for RVers. TouristEye accesses pre-made guides, creates custom itineraries, and allows collaborative planning. Overall, these apps make it easier than ever to plan the perfect road trip by combining features such as route planning, finding attractions, and discovering food stops and restaurants into one comprehensive tool.

How can we ensure that climate policy assessments are inclusive and consider the needs of marginalized groups ?
In order to ensure that climate policy assessments are inclusive and consider the needs of marginalized groups, it is important to: 1. Identify and engage with marginalized groups such as Indigenous peoples, low-income communities, people with disabilities, women and girls, minority ethnic and racial groups, and urban and rural poor. 2. Conduct participatory research and data collection methods such as community mapping, photovoice, mobile interviews, and storytelling workshops. 3. Incorporate intersectionality into policy design by analyzing data, consulting with experts in fields such as gender studies, disability rights, and environmental justice, and developing targeted interventions that address the specific needs and priorities of marginalized groups. 4. Promote transparency and accountability by involving the public in the policy-making process through public consultations, hearings, and other means, providing information about climate policies in accessible formats, and regularly monitoring and evaluating the effectiveness of climate policies in meeting the needs of marginalized groups.